INSIGHTS MATTER!
Base your next geo-marketing decision on analytics & science! MediaMap provides retail location analytics right down to suburb level. We empower you with accurate geo-marketing statistics and revenue forecasting. A decade of experience gives us the confidence to run the numbers and show you where to open your next thriving store. Count on us for insights . . .

Trend analytics to reveal new markets!
Our map-based infographic reports are filled with insights you need about potential customers when making that next geo-marketing decision.

Trade area analytics and insights!

Revenue forecasting at suburb level!
Our revenue forecasting models span across all retail sectors and are tried and tested with actual sales data. Consumer expenditure data, in conjunction with competitor proximity analysis, is used to calculate your retail revenue share. We find your portion of 2015 annual retail consumer expenditure estimated at R2,4 trillion. We show you where to open your next thriving store.
RETAIL SECTORS COVERED:
Food and Non-alcoholic Beverages; Alcoholic Beverages and Tobacco; Clothing and Footwear; Housing and Utilities; Household Contents, Equipment and Maintenance; Health; Transport; Household Supplies and Services; Communication; Recreation and Culture; Education; Restaurants and Hotels; Miscellaneous Goods and Services

Retail consumer expenditure
SUBURB-LEVEL 2015 CONSUMER EXPENDITURE DATA FOR ACCURATE REVENUE FORECASTING.
8%
4%
40%
15%
5%
6%
1%
5%
16%
100%
Case Studies
ARIEL
V-Slots
CASHBUILD
GEO-Marketing, Site selection & Location Analytics
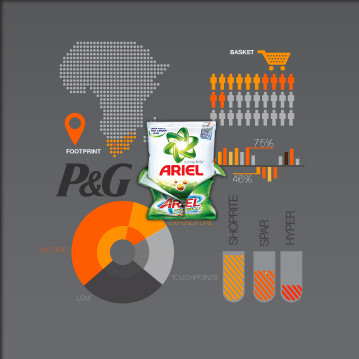
ARIEL
P&G South Africa contracted our services to assist with the launch of Ariel washing powder.
We designed an interactive map-based platform to show a birds-eye view of their geo-marketing plan. Vast amounts of demographic and sales data was used to identify top performing FMCG stores by channel.
Once selected the stores were classified by consumer group and propensity to buy washing powder. The Arial campaign exceeded expectations by two thirds and set a new standard for future P&G product launches.
Click here to email us
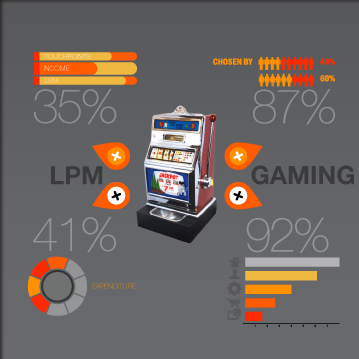
V-Slots
V-Slots is a leading South African gaming company. Mediamap was contracted to assist with optimal site selection for their Gauteng gaming license application.
We achieved a 99% accuracy level and produced a ranked list of 1000 potential sites. The locations we originally suggested are today also top performing sites for V-Slots.
Click here to email us
CASHBUILD
GEO-Marketing, Site selection & Location Analytics
Cashbuild is a leading building material retailer and makes use of our location analytics service for all new store placements.
Cashbuild store locations to streamline their geo-marketing strategy and
save costs. We continue to add value to Cashbuild on a monthly basis
Click here to email us
Our Clients


Contact Details

PO Box 436, Edenvale, 1610, Gauteng, South Africa